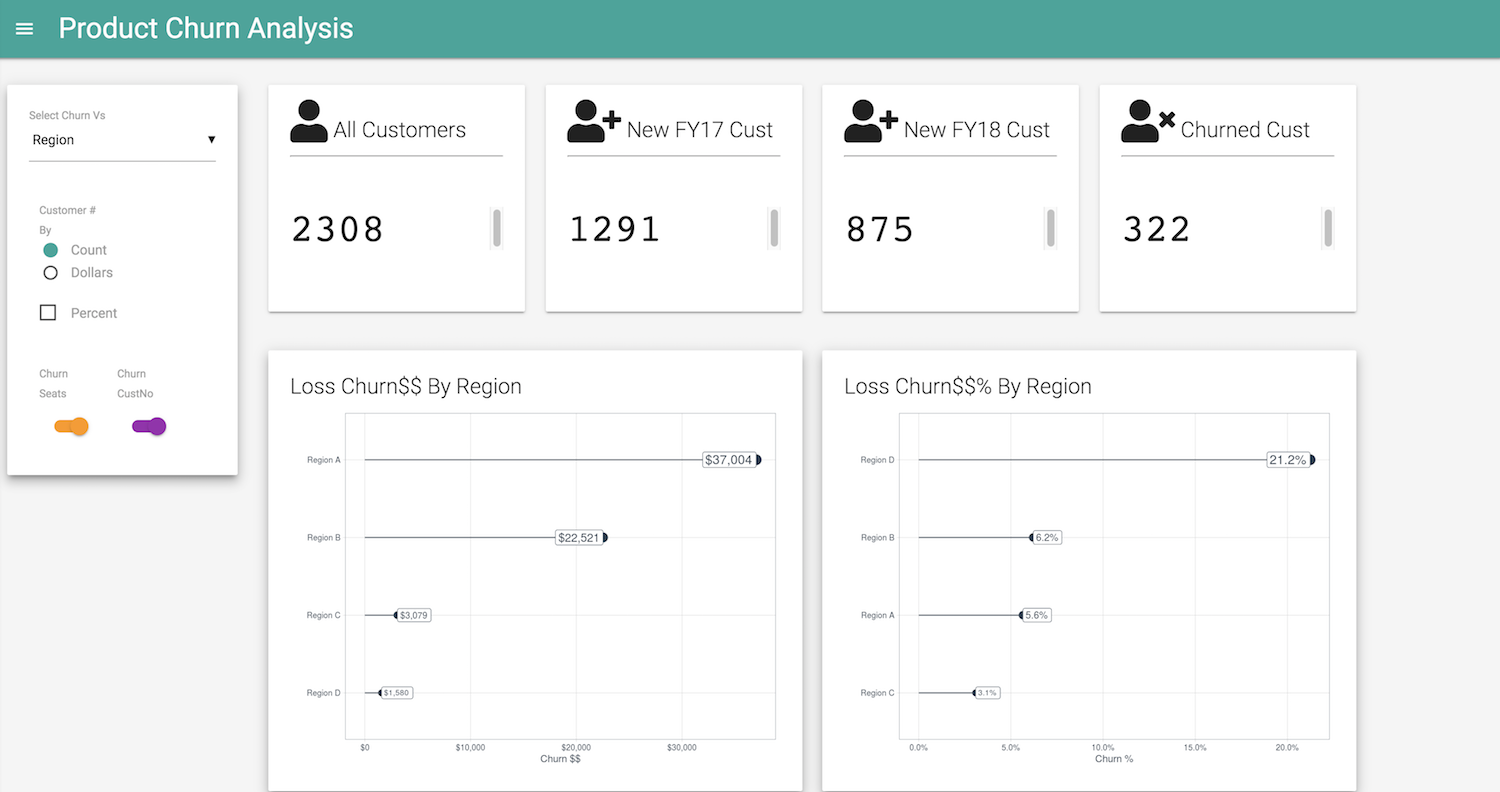
One of the business issues was to figure out a balanced distribution of the world wide and US sales force so as to maximize order dollars. This required figuring out each Product Line’s geographical strength and weaknesses in terms of Order $$ and a further drill-down on each of the top performers within the product line. Generating insights for each of the products and a summary per their Product Line meant reusing the same shiny app code for each of those products, for which shiny modules…
Churn Predictive Analytics ShinyMaterial App


