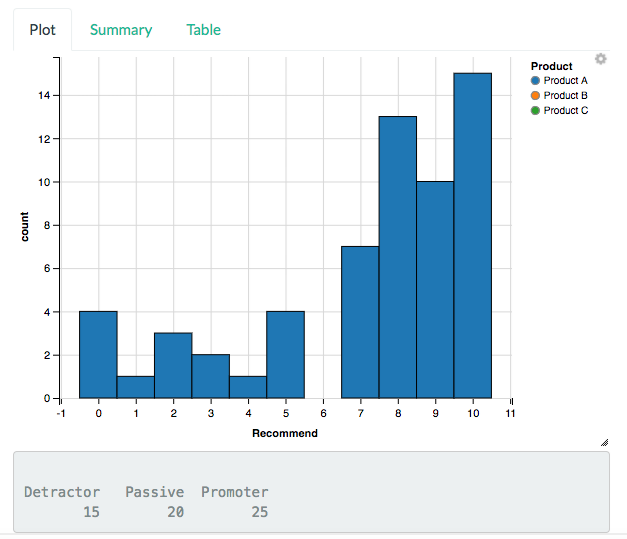
“How likely are you to recommend”Company A" to a friend?" is an Net Promoter Score (NPS) question (Likelihood to Recommend/LTR) which categorizes the responses(voice of the customers) under 3 camps:
| Customers | LTR_Score |
|---|---|
| Promoters | 9 or 10 |
| Passives | 7 or 8 |
| Detractors | 0 to 6 |
A customer loyalty metric introduced by Fred Reicheld, Founder of Bain & Company’s Loyalty Practice, the Net Promoter Score (NPS) is used at my work as a compass by business decision makers to understand if NPS provides an insight to what drives customers to repeat purchase, referrals, and resistance to competitor offerings. Does higher NPS mean repeat purchases? Referrals? Loyalty to brand/resistance to competitors?
This post however will not dwell on the interpretation of the NPS results for decision making (this is a subject matter for another post), but rather building a simple shiny app (first app) using ggvis and the NPS package in R authored by Brendan Rocks, which provides functions that make working with the NPS survey data easier; includes Data transformation methods, statistical properties (variance & SE), and simple inferential testing procedures. Brendan Rocks, yes ‘Rocks’ is indeed his last name, was kind enough to help out with answering some of the questions I had on the NPS functions. Thank you Brendan.


Share this post
Twitter
Google+
Facebook
Reddit
LinkedIn
StumbleUpon
Pinterest
Email